Special Structures Lab use the NDN Membrane or Easy NT suite of analysis tools.

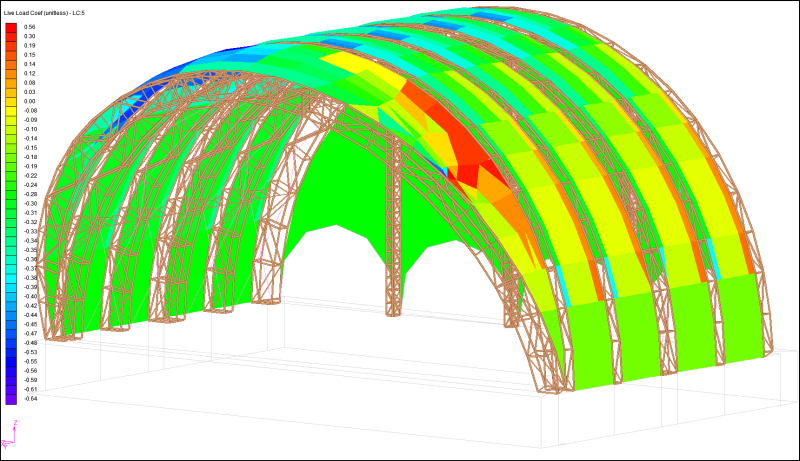
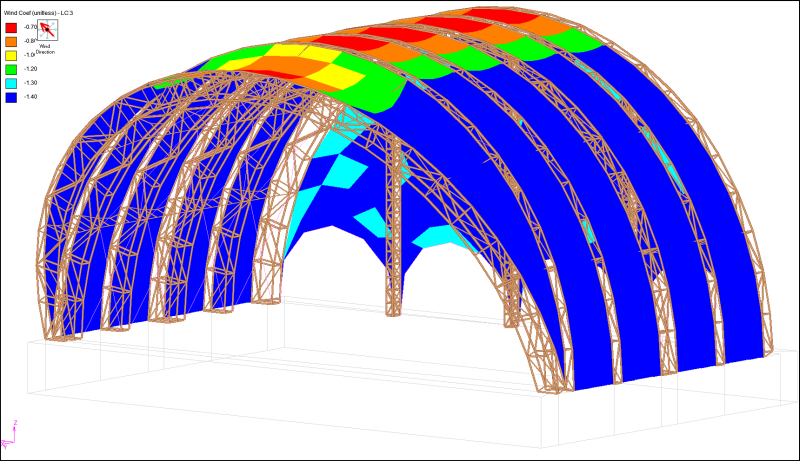
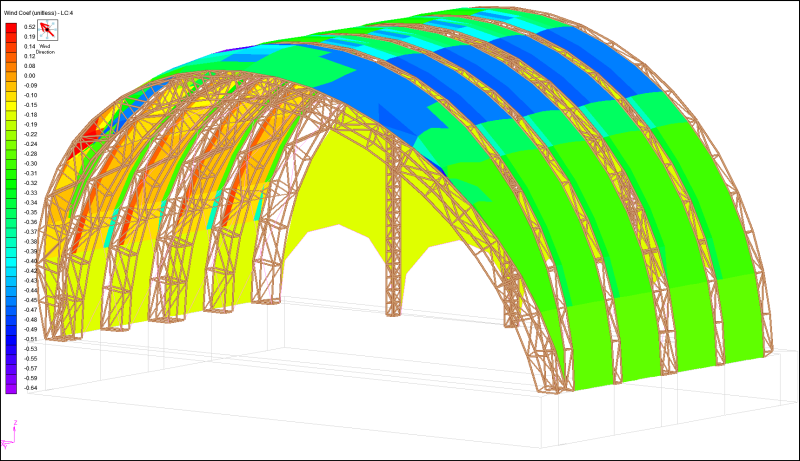
Typical membrane structures defy classical analysis. Modern engineers use sophisticated software tools to generate virtual models which can represent the real world project. Every part of the virtual model can have propertiesRudi Enos Design lc16-135deg-b-loading 
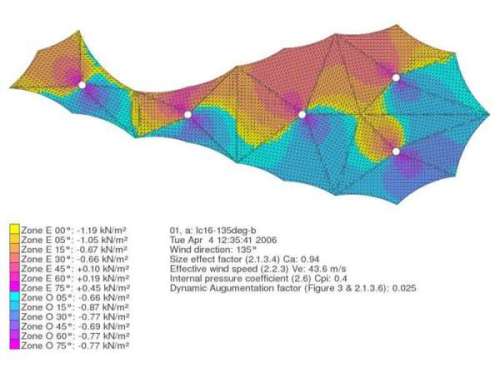
simulated to represent forces and structural components in software. The model can then have surface pressures defined from projected wind patterns and assigned. There are two main methods used to determine equilibrium shape in the commercial world of membrane roof manufacture. These are the 'dynamic relaxation' method and the 'force density method. SSL use the force density method with Easy NT.

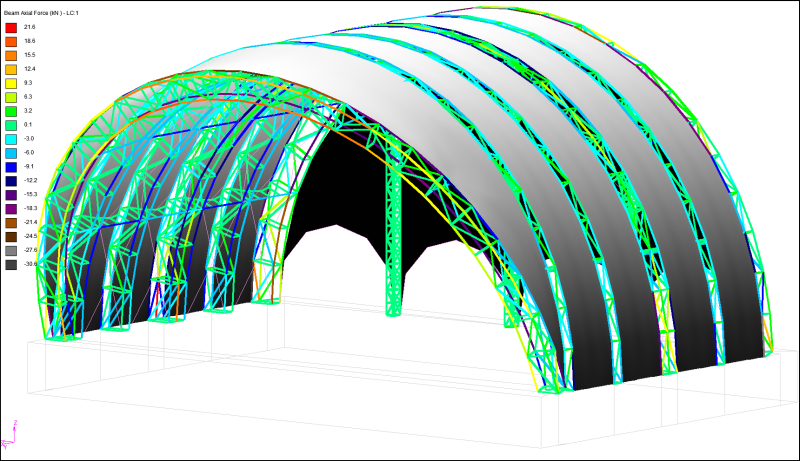
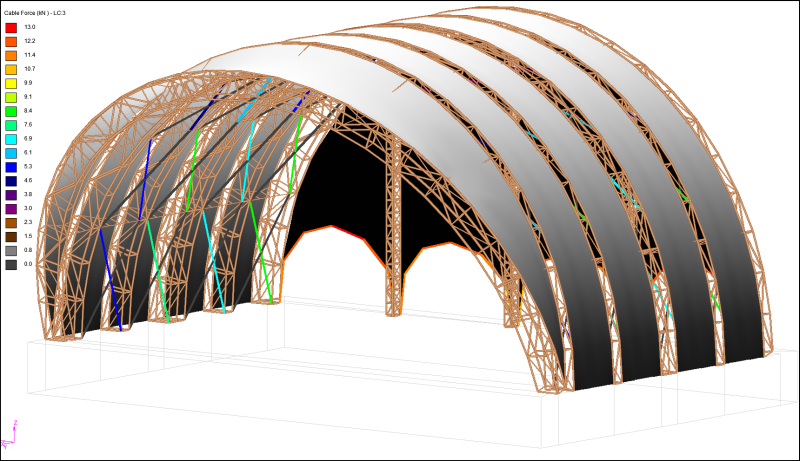
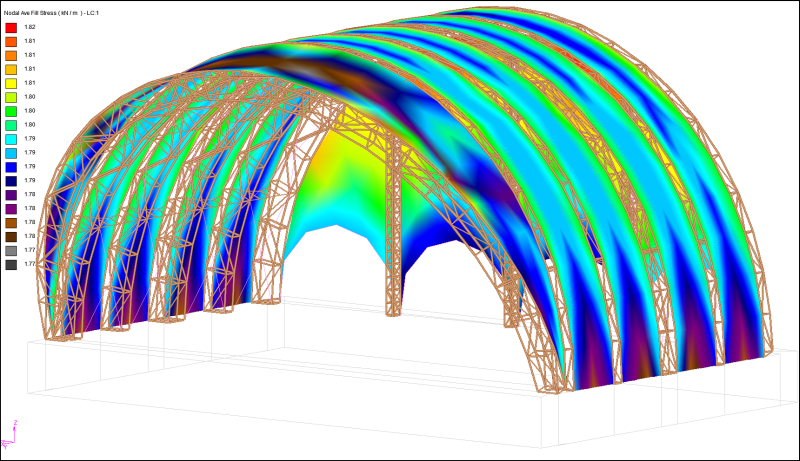
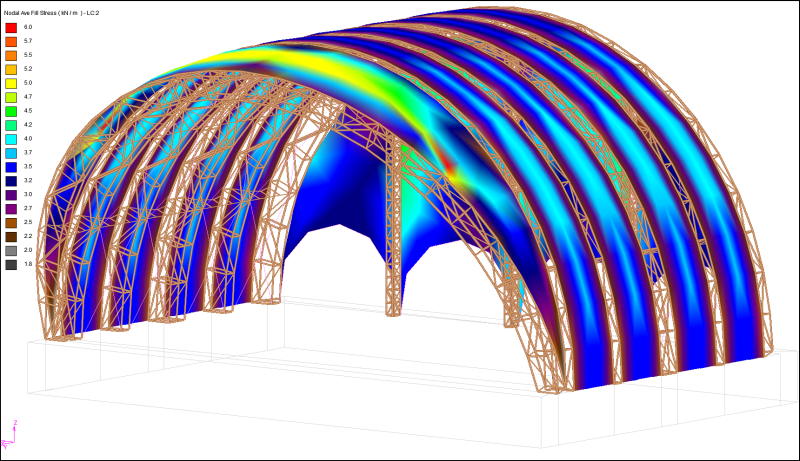
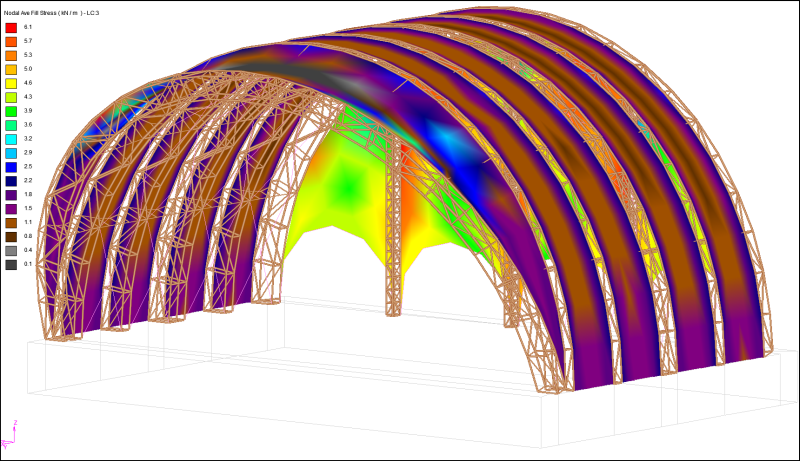
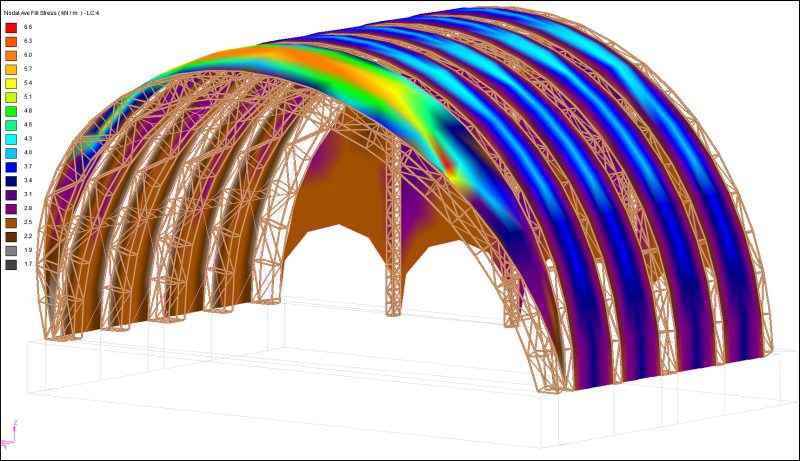
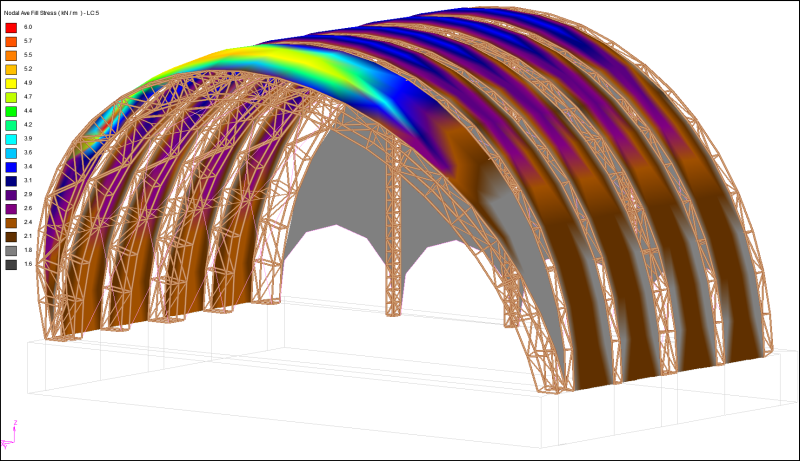
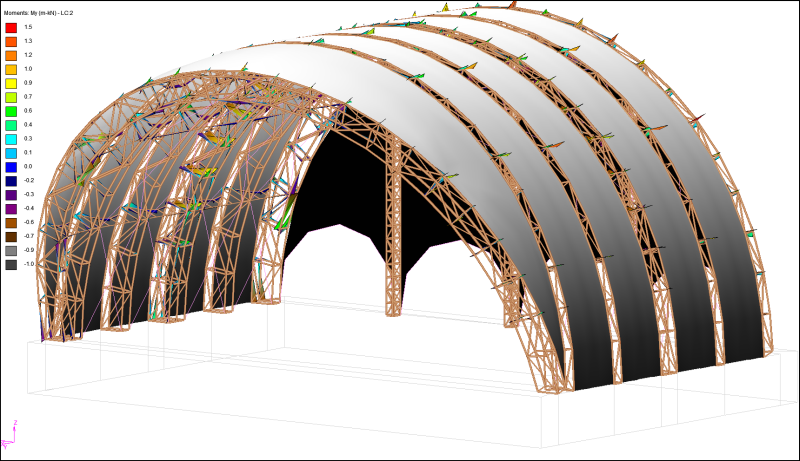
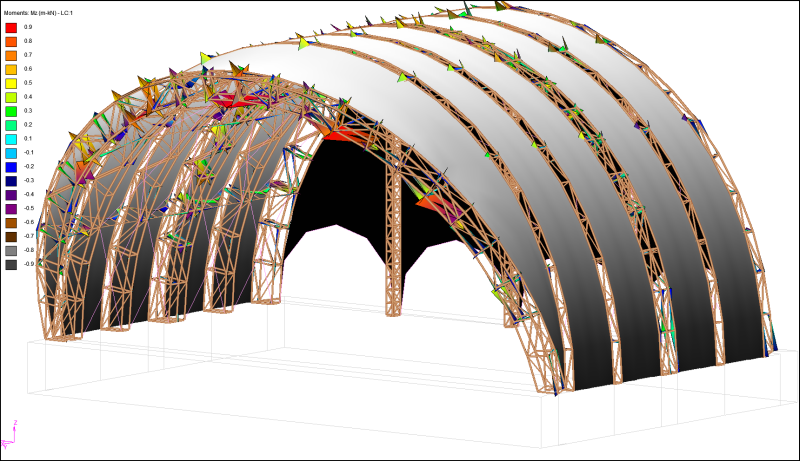
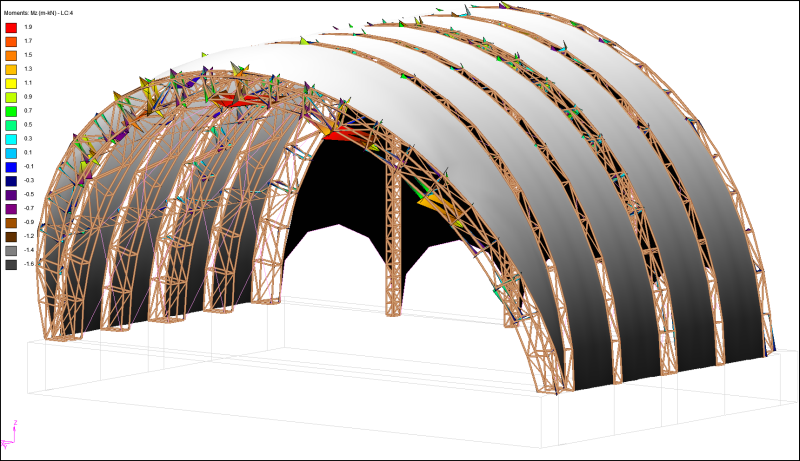
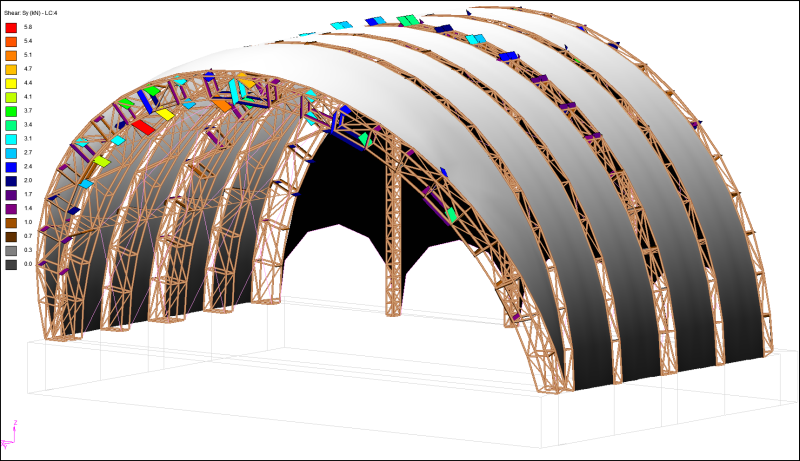
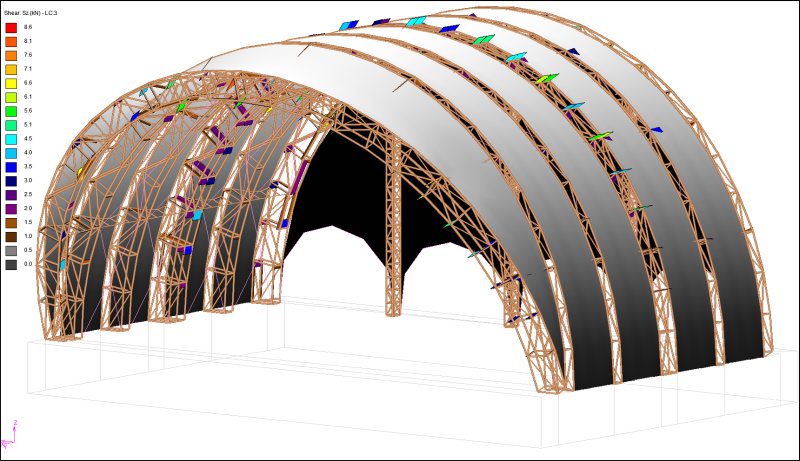
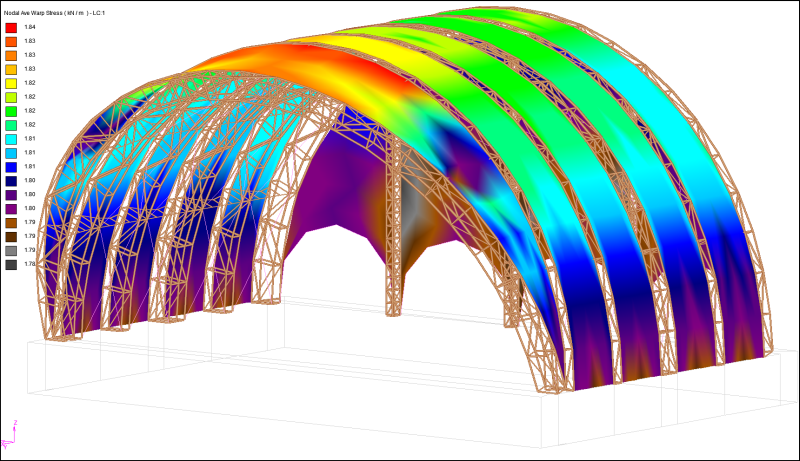
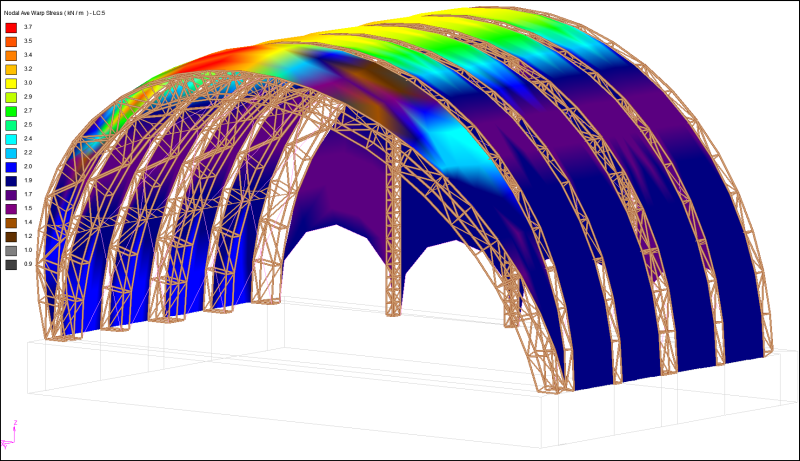
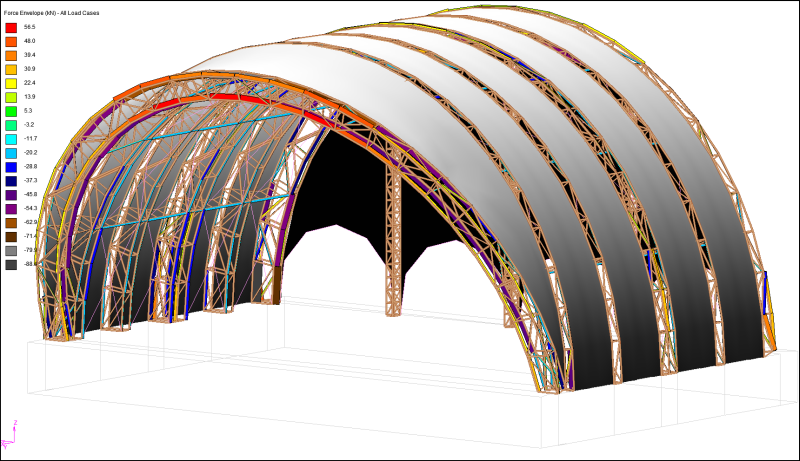
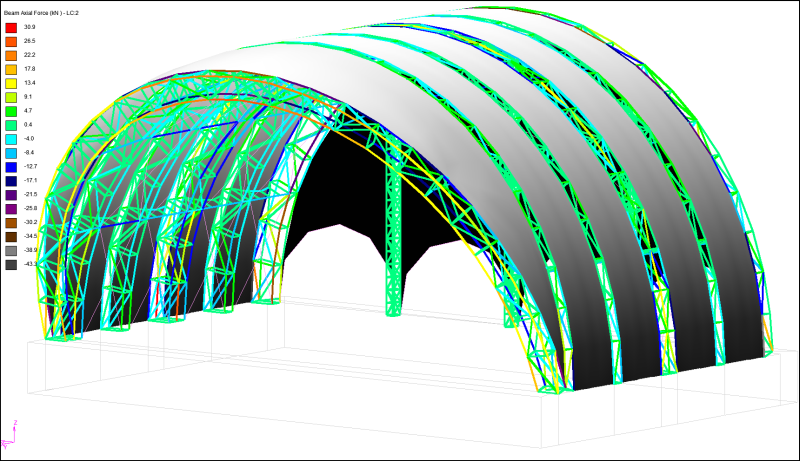
Membrane surfaces exhibit both geometric non-linearity due to large deflections in addition to fabric non-linearity. Non linear analysis is used where displacement may not equal the applied force depending on scale. The surface is normally represented as a mesh. The representative mesh is analysed using non linear FEA (finite element analysis) to determine the forces in the membrane, the perimeter cables and the loads to the main supporting elements. The elements are usually masts and cables, but beams, concrete members or even timber can provide support.

  • Special_Structures_Lab_Analysis_Example_001.png
  • Special_Structures_Lab_Analysis_Example_002.png
  • Special_Structures_Lab_Analysis_Example_003.png
  • Special_Structures_Lab_Analysis_Example_004.png
  • Special_Structures_Lab_Analysis_Example_005.png
  • Special_Structures_Lab_Analysis_Example_006.png
  • Special_Structures_Lab_Analysis_Example_007.png
  • Special_Structures_Lab_Analysis_Example_008.png
  • Special_Structures_Lab_Analysis_Example_009.png
  • Special_Structures_Lab_Analysis_Example_010.png
  • Special_Structures_Lab_Analysis_Example_011.png
  • Special_Structures_Lab_Analysis_Example_012.png
  • Special_Structures_Lab_Analysis_Example_013.png
  • Special_Structures_Lab_Analysis_Example_014.png
  • Special_Structures_Lab_Analysis_Example_015.png
  • Special_Structures_Lab_Analysis_Example_016.png
  • Special_Structures_Lab_Analysis_Example_017.png
  • Special_Structures_Lab_Analysis_Example_018.png
  • Special_Structures_Lab_Analysis_Example_019.png
  • Special_Structures_Lab_Analysis_Example_020.png
  • Special_Structures_Lab_Analysis_Example_021.png
  • Special_Structures_Lab_Analysis_Example_022.png
  • Special_Structures_Lab_Analysis_Example_023.png
  • Special_Structures_Lab_Analysis_Example_024.png
  • Special_Structures_Lab_Analysis_Example_025.png
  • Special_Structures_Lab_Analysis_Example_026.png
  • Special_Structures_Lab_Analysis_Example_027.png
  • Special_Structures_Lab_Analysis_Example_028.png
  • Special_Structures_Lab_Analysis_Example_029.png
  • Special_Structures_Lab_Analysis_Example_030.png
  • Special_Structures_Lab_Analysis_Example_031.png
  • Special_Structures_Lab_Analysis_Example_032.png
  • Special_Structures_Lab_Analysis_Example_033.png
  • Special_Structures_Lab_Analysis_Example_034.png
  • Special_Structures_Lab_Analysis_Example_035.png
  • Special_Structures_Lab_Analysis_Example_036.png
  • Special_Structures_Lab_Analysis_Example_037.png
  • Special_Structures_Lab_Analysis_Example_038.png
  • Special_Structures_Lab_Analysis_Example_039.png
  • Special_Structures_Lab_Analysis_Example_040.png
  • Special_Structures_Lab_Analysis_Example_041.png
  • Special_Structures_Lab_Analysis_Example_042.png
  • Special_Structures_Lab_Analysis_Example_043.png
  • Special_Structures_Lab_Analysis_Example_044.png
  • Special_Structures_Lab_Analysis_Example_045.png
  • Special_Structures_Lab_Analysis_Example_046.png
  • Special_Structures_Lab_Analysis_Example_047.png
  • Special_Structures_Lab_Analysis_Example_048.png
  • Special_Structures_Lab_Analysis_Example_049.png
  • Special_Structures_Lab_Analysis_Example_050.png
  • Special_Structures_Lab_Analysis_Example_051.png
  • Special_Structures_Lab_Analysis_Example_052.png
  • Special_Structures_Lab_Analysis_Example_053.png
  • Special_Structures_Lab_Analysis_Example_054.png
  • Special_Structures_Lab_Analysis_Example_055.png
  • Special_Structures_Lab_Analysis_Example_056.png
  • Special_Structures_Lab_Analysis_Example_057.png
  • Special_Structures_Lab_Analysis_Example_058.png

The research engineer tries to develop new principles and processes by using mathematics, scientific concepts, and experimentation. For instance, large computer simulations developed by research engineers permit the prediction of the performance of the structure prior to manufacture. It is possible to predict the deformation of the membrane under varying environmental conditions using non linear Finite Element Analysis tools, depending on the stiffness and stretch characteristics of the materials chosen.

By testing a representative sample of test pieces in the laboratory, a reference configuration for the structural fabric is arrived at. This reference configuration is modelled and simulated in software, then analysed using different parameters until the software model exhibits deformation and stress/strain results similar to the real world tests. The software can then be said to be calibrated to the material being analysed.

The development of tensioned fabric membranes has gone from the use of early stocking models and 'soap bubble' tests to the current use of multi programme software suites. Special non linear techniques are necessary for the structural analysis of tension structures, since membranes undergo large shape changes under varying load conditions and fabric materials exhibit complex stress-strain response. Finite element techniques can be used to solve these non-linear problems. FEA or finite element analysis breaks down the surface into finite elements or areas and analyses the reaction effects and inter relationships of the elements.